+
Integration available
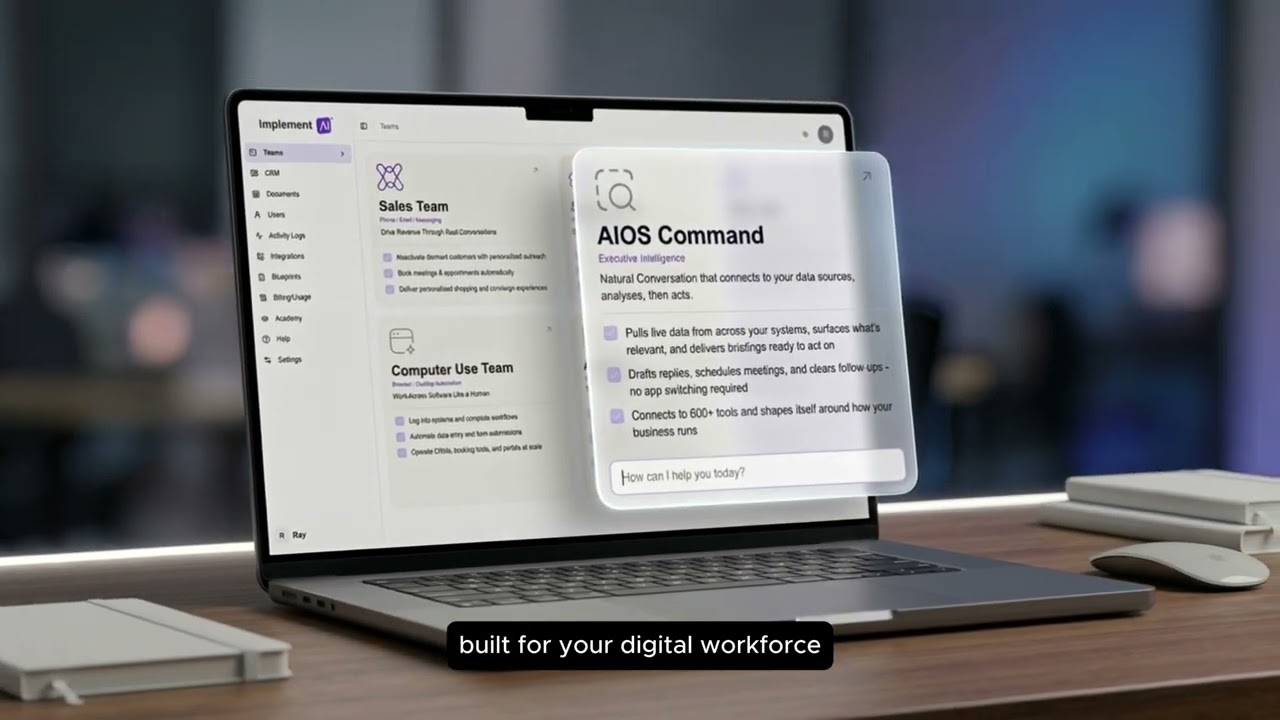
Connect Vercel
to AIOS Command
Your Vercel team has shipped thousands of deploys nobody has audited. Command reads every build, every preview, every edge function, and rebuilds a delivery picture your engineering leads never had.