AIOS Command
AIOS Command
+
PagerDuty
PagerDuty
Integration available
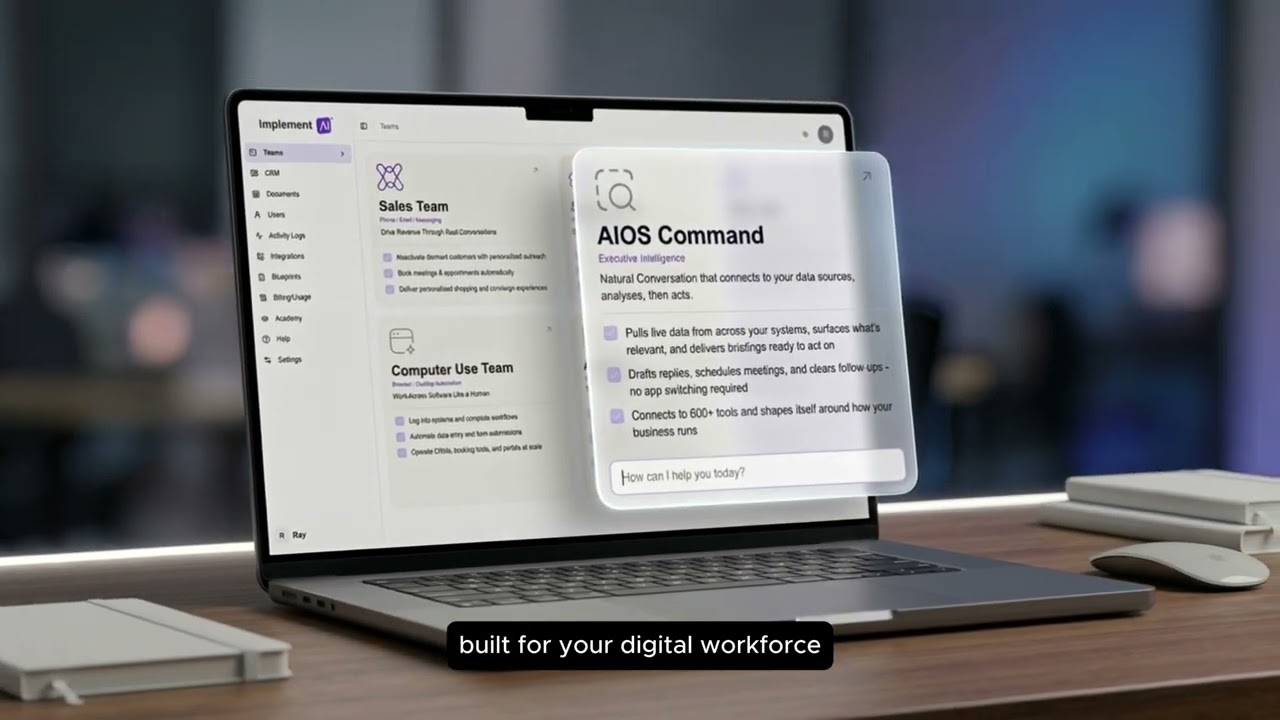
Connect PagerDuty
to AIOS Command

Your incident history holds two years of paging patterns, escalation drift, and silent failure modes nobody has ever reviewed. Command reads every alert, runbook, and post-incident note, and turns it into the operational intelligence your engineering leadership always wanted.

Trusted by

Cyber Essentials
99.5% Uptime SLA
£2B+ Client Revenue Managed
UK-Based Servers

Command found these insights in a single PagerDuty account within one hour

Hidden burnout

7 engineers paged more than 14 times a week, 3 services responsible for 62% of out-of-hours alerts, and 11 runbooks last touched over 12 months ago.

One PagerDuty account. One sweep. One hour.

Escalation drift

9 escalation policies routing around the named on-call, 4 with no secondary, and 6 services on policies that no longer match the team that owns them.

Shadow Notes read between the alerts.

Incident intelligence

44% of incidents resolved in under 5 minutes - silent noise nobody is tuning. The rest contains repeat offenders, missing runbooks, and post-mortems never written.

First insights within 48 hours.
Watch: How AIOS Command works with PagerDuty
How does AIOS Command work with PagerDuty?
AIOS Command connects directly to your PagerDuty account via secure OAuth authentication. It reviews your full incident history, escalation policies, on-call schedules, and runbook activity. Command then surfaces patterns your SRE team cannot see in standard reports, including services that page out of hours but never get post-mortems, escalation policies that route around the on-call, and engineers carrying silent burnout load. Updates flow back into your PagerDuty workspace, so when Command drafts a post-incident note or flags a stale runbook, it appears as an action ready for review. No incident data is copied to external servers - analysis happens in your workspace.
Welcome to the future of work
Your AI team is ready
1 integration connected · PagerDuty synced
Morning
General
Morning Briefing
Inbox Triage
Meeting Prep
Quick Wins
What would you like your digital workforce to do?

Ask Command about your PagerDuty

What happens today

Every quarter someone in engineering exports incident data, drops it into a spreadsheet, and tries to spot the pattern. Most quarters they give up. Burnout signals stay invisible. Runbooks stay stale. The real cost of your incident load never makes it into the engineering review.

You have thousands of incidents buried in PagerDuty. You have no idea which engineers are silently absorbing the load, which services keep paging without post-mortems, or which escalation policies are routing around the people who can actually fix things. Your dashboards reflect last quarter, not last night. Your true operational reality lives only in PagerDuty, and nobody can see it.

Every week those 7 engineers carry 14+ pages each is another week of attrition risk walking out before anyone admits it.

1
Export PagerDuty incidents into a spreadsheet
2
Manually pivot by service, time of day, and engineer
3
Chase service owners for runbook updates that never come
4
Miss the engineer paged more than anyone else
5
Burnout signal never lands in the engineering review

What Command sees in your PagerDuty

Command doesn't summarise alerts. It infers. It reads your PagerDuty account once and extracts 40+ behavioural rules that describe your incident patterns, your escalation drift, and your true on-call load.

Shadow Notes surface what runbooks aren't saying. Operational intelligence emerges from incident flow alone. Your digital twin knows which engineers are silently overloaded, which services are running on stale runbooks, and which escalation policies have drifted away from the team that actually owns the system.

Within 48 hours, Command builds you an operational ledger from PagerDuty data alone: 7 engineers at burnout risk, 11 stale runbooks, 9 drifted escalation policies, 3 noisy services driving most of the load.

Digital Twin Extracted
40+
operational rules
Thousands
incidents reviewed
11
stale runbooks flagged
Real-time
burnout alerts

The two digital workers in Command

Insight Team

Watches every alert and resolution, surfaces what your SRE team is missing. Extracts patterns, identifies burnout, surfaces shadow notes, finds operational risk.

Reads your entire PagerDuty history in minutes
Identifies 7+ engineers carrying silent paging load
Flags 11 runbooks last updated over a year ago
Builds 40+ behavioural rules from your incident patterns
Generates shadow notes on every post-incident review

Action Team

Drafts post-incident summaries, prepares escalation policy updates, manages runbook reviews, handles on-call rotation reminders.

Drafts post-mortems that match your engineering tone
Prepares responses to every customer-facing incident
Manages on-call schedule reminders automatically
Reactivates stalled runbook reviews
Syncs directly to your PagerDuty incident notes

Before and after Command

Before Command
Burnout signals only surface at exit interviews
No visibility into noisy services nobody is tuning
Stale runbooks discovered mid-incident
Post-mortems written from scratch every time
Dashboards are disconnected from on-call reality
Nobody tracks paging load by engineer
Operational intelligence costs quarters
After Command
Burnout flagged within minutes of each rotation
Complete sweep identifies every noisy service
Every stale runbook surfaced within 48 hours
Post-mortems drafted in your engineering tone, ready to review
True on-call reality emerges from PagerDuty data alone
Every paging spike tracked and surfaced
Operational intelligence costs 48 hours

What Command can do with your PagerDuty

Auto-draft post-incident notes

Command writes structured post-mortems in your engineering tone and drops them into your PagerDuty incident timeline, ready to review and send.

Track every escalation drift

Flags policies routing around the on-call, services without secondaries, and runbooks long out of date. Nothing slips through.

Surface silent burnout

Reads the full paging history of every engineer and drafts a clear case for rotation rebalancing with real context.

Search every incident instantly

Find any incident by service, engineer, severity, or time of day across your entire PagerDuty history in seconds.

Common questions about PagerDuty integration

Is my incident data stored outside PagerDuty?

Your records remain in your PagerDuty account. Command analyses them in your workspace using secure OAuth authentication. No incident data is copied to external servers. Your data stays yours.

Can Command draft post-mortems that sound like my engineers?

Yes. Command extracts your communication patterns, escalation tone, and decision velocity from your existing post-incident notes. It builds a digital twin of your engineering voice, so every draft sounds like your team wrote it.

How long does it take to connect PagerDuty?

One click. You authorise Command via OAuth, and it begins analysing your incidents immediately. You will see your first actionable insights within 48 hours.

Does this replace my observability stack?

No. Command builds intelligence from your incident metadata that your observability dashboards do not surface. It finds burnout, uncovers escalation drift, and reveals operational signals dashboards miss. Think of it as the digital worker that audits your on-call.

What about PagerDuty on mobile vs. web?

Command works regardless. It connects to your PagerDuty account directly. Whether your team uses the web app, desktop, or mobile, Command reads the same data.

Can I revoke access at any time?

Yes. Command uses standard OAuth. You can revoke access anytime in your PagerDuty account settings. Command stops working immediately.

Does Command handle multiple services and teams?

Command reads your entire PagerDuty workspace, including all services, escalation policies, and historical incidents. It does not filter - it analyses patterns across every alert you have ever paged on.

Connect your PagerDuty. See what's hiding.

Your incident history knows more than your dashboards. Command finds the operational signals hiding in 7 engineers at burnout risk, 11 stale runbooks, and 44% of alerts resolved before anyone tuned them.

One-click OAuth. Live within 48 hours. No IT team required.

Command also connects with

Gmail Gmail Slack Slack HubSpot HubSpot Google Calendar Google Calendar Salesforce Salesforce Teams Microsoft Teams