+
Integration available
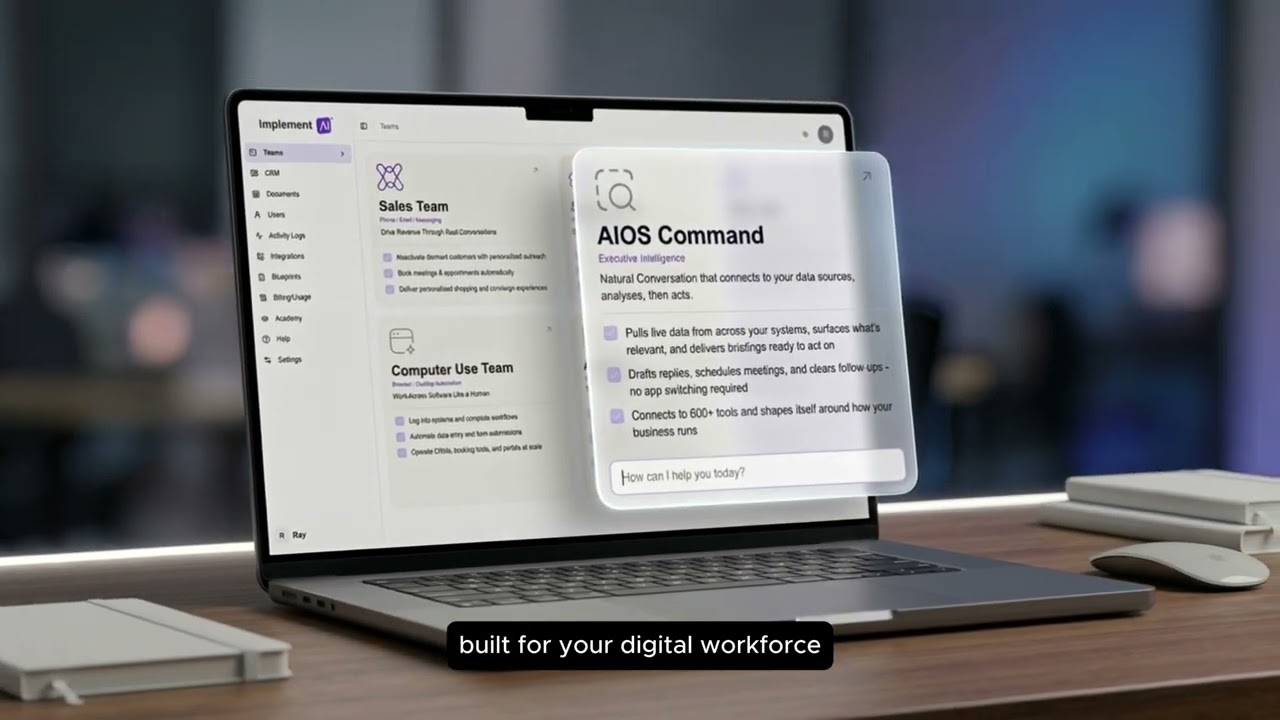
Connect New Relic
to AIOS Command
Your APM data holds three years of latency drift, error budgets quietly burning, and dashboards nobody actually reads. Command reads every transaction, alert policy, and service map, and turns it into the observability intelligence your engineering leadership always wanted.