+
Integration available
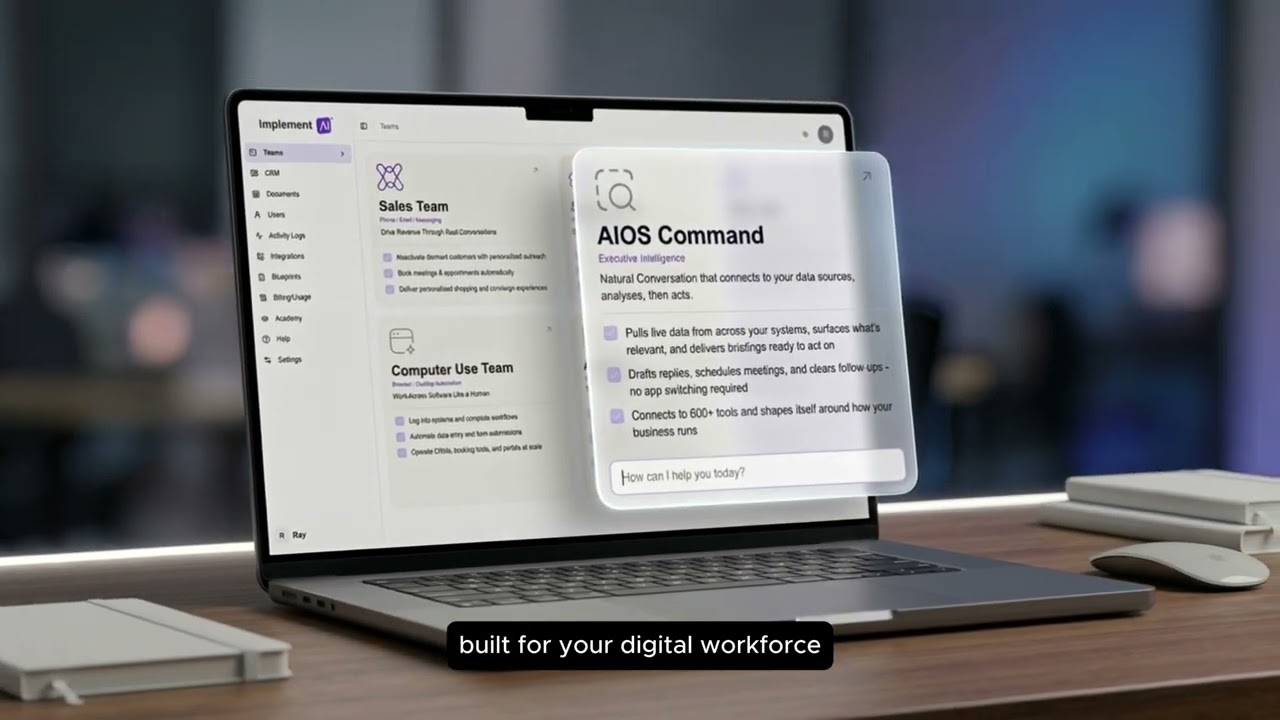
Connect GitLab
to AIOS Command
Your repositories hold two years of engineering patterns nobody has ever analysed. Command reads every merge request, every pipeline run, and every review cycle to surface where delivery is stalling and where your team is at its sharpest.